
Cross-Market Intelligence
Buy-Sell Ratio
Overview
The buy/sell ratio calculates the proportion of buy transactions to sell transactions in a market over a period. It gauges whether buying or selling prevails. A balanced market tends towards 0.4-0.6.
Mathematical Background
Buy/Sell Ratio

The formula calculates the ratio of buy trades to the total number of trades. This ratio helps in understanding the frequency of buying relative to selling.
Buy/Sell Ratio Absolute

This formula measures the total volume of buy trades against the total volume of all trades. Unlike the Buy/Sell Ratio, which counts the number of trades, this ratio considers the size of trades, giving a sense of the market’s weight in terms of buying versus selling. A higher value signifies a greater volume of buying, while a lower value indicates more selling volume.
Metrics in the API Response
buysellratio: This metric reflects the frequency of buying versus selling in the market. A higher value indicates more buy trades compared to sell trades, suggesting a buying trend. Such a scenario could lead to a price increase. Conversely, a lower value points to a prevalence of selling, possibly leading to a price decrease.
buysellratioabs: This metric, while similar in purpose to the buysellratio, focuses on the volume of trades instead of their count. It is calculated by dividing the total volume of buy trades by the total volume of all trades. A higher value here means that the volume of buying is greater, indicating a strong buying pressure, while a lower value suggests a higher volume of selling.
The main difference between these two metrics is that the first one (Buy/Sell Ratio) considers the number of trades, while the second one (Buy/Sell Ratio Absolute) takes into account the volume of these trades, offering a more weight-based perspective of the market’s activity.
Example
 {
        "timestamp": "2023-12-25T23:58:00.000Z",
        "marketvenueid": "okx",
        "pairid": "btc-usdt",
        "buysellratio": 0.4211,
        "buysellratioabs": 0.4197,
    }
Usage Example
An analysis was conducted on the binance-eth-usdt market over a specific period of 1 hour.
Steps Taken:
- Compiled the buy-sell ratios and absolute buy-sell ratios from the dataset.
- Calculated basic statistical details like mean, standard deviation, minimum, and maximum values.
Analysis Results:
The dataset comprised 60 data points with the following statistical insights:
- Buy-Sell Ratio:
- Mean: 0.488
- Standard Deviation: 0.135
- Minimum: 0.197
- Maximum: 0.710
- Buy-Sell Ratio Absolute:
- Mean: 0.519
- Standard Deviation: 0.181
- Minimum: 0.177
- Maximum: 0.846
Interpretation:
- The mean Buy-Sell Ratio being less than 1 indicates a slight tendency towards sell transactions over this period.
- The Absolute Buy-Sell Ratio provides additional context, suggesting that while sell transactions might be more frequent, the discrepancy is not extremely significant.
- Variations in the Buy-Sell Ratio could indicate shifts in market sentiment or reaction to external events.
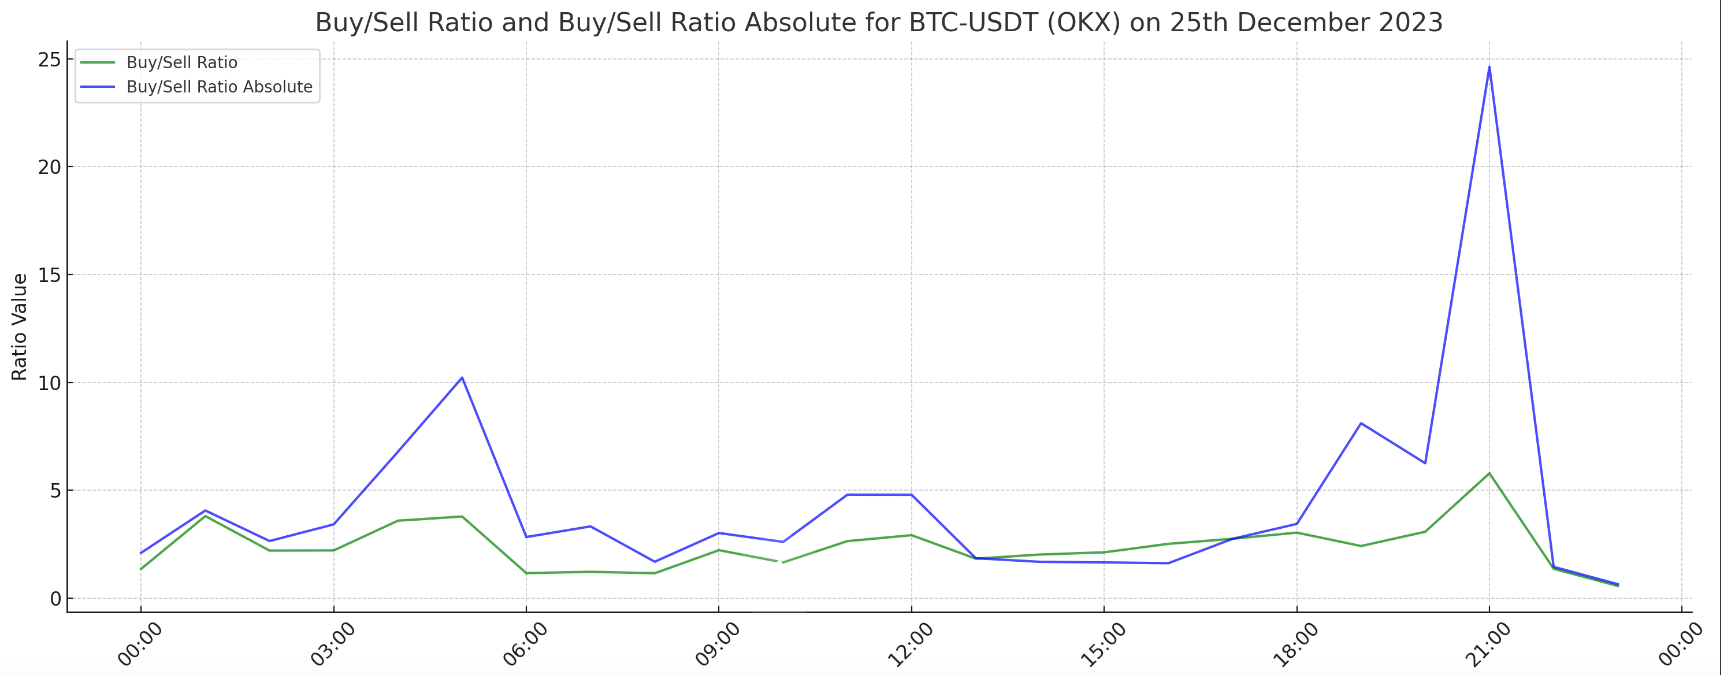
Visuals
Visual representations, such as line graphs or histograms, can be used to illustrate the distribution and trends of the Buy-Sell Ratio and Buy-Sell Ratio Absolute over time, providing a more intuitive understanding of market dynamics.
Applications in Market Surveillance
-
Detecting buy/sell Imbalances: Sustained buy/sell imbalance may indicate manipulative efforts to drive prices up or down.
-
Identifying Emerging Trends: Shifts in typical ratio levels can signal changing market biases, useful for strategy adaptation.
-
Uncovering Coordinated Behaviors: If sudden buy/sell imbalances appear concurrently across exchanges, it may suggest coordinated manipulation.
-
Establishing Expected Ranges: Calculate historical ratio ranges to detect anomalies outside normal thresholds.
-
Combining With Other Metrics: Inspecting aligned ratio spikes with volume or volatility changes can help uncover tactics like wash trading and artificial transactions.
Considerations for Cryptocurrencies
- High volatility causing frequent trade fluctuations
- Prevalence of algorithmic trading executing large volumes of small transactions
- Lower liquidity amplifying ratio impact
Key Takeaways
- Buy/sell ratio indicates market trade dominance.
- Significant deviations may signal manipulation.
- Changes can identify emerging trends.
- Ratios should be analyzed with other metrics.
- Cryptocurrency markets have unique trade flow dynamics.