
Cross-Market Intelligence
Volatility
Overview
The volatility metric quantifies the degree of price variation for a cryptocurrency trading market over a specified timeframe. It indicates the price stability or instability of the market. Higher volatility signals greater price fluctuations and wider trading ranges. Lower volatility implies more stable, narrower trading.
Mathematical Background
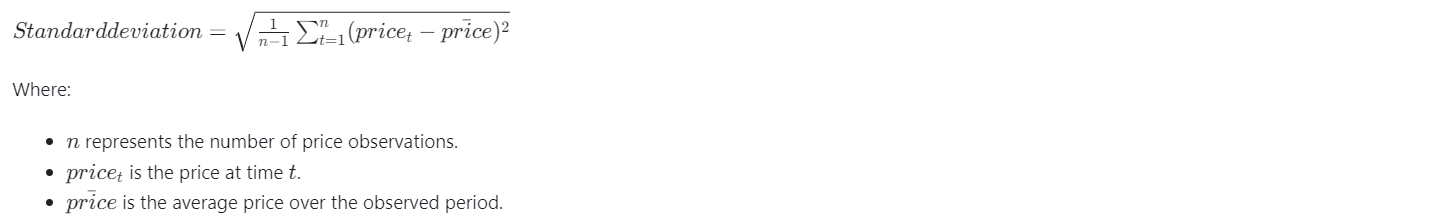
Volatility is calculated as the standard deviation of the pair’s prices in the given period. Standard deviation measures dispersion of values from their average. In finance, it captures asset price variability.
The formula for calculating the standard deviation (and hence the volatility) is as follows:
Metric in the API Response
{
  "timestamp": "2024-01-18T10:05:00.000Z",
  "marketvenue": "binance",
  "pair": "ada-usdt",
  "volatility": 0.0052
}
Applications in Market Surveillance
-
Detecting Artificial Volatility: Unexpected spikes or drops in volatility could indicate potential wash trading or pump and dump schemes artificially inflating activity.
-
Volatility Around Large Trades: If volatility rises sharply around a few large trades, it may suggest deliberate actions to move the market. Natural volatility typically aligns with overall trading volumes.
-
Volatility Without News or Events: Heightened volatility without clear fundamental drivers like news events or announcements may indicate manipulation targeting rapid price swings.
-
Visualizing Volatility Trends: Graphing volatility over time can reveal abnormal patterns or divergences from established trading ranges, signaling potential manipulation.
-
Volatility Across Exchanges: Comparing volatility across different exchanges can uncover outliers potentially engaged in manipulative behaviors. Natural market volatility tends to impact major exchanges concurrently.
-
Integration With Other Metrics: Inspecting aligned spikes in metrics like trade count, volume, volatility may reveal coordinated manipulation tactics.
-
Establishing Normalized Ranges: Calculate historical volatility ranges for a trading pair to better detect anomalies and actions outside of normal boundaries that may warrant investigation.
Interpretation
Continuously monitoring volatility trends and patterns, establishing expected trading ranges, and detecting divergences or clustering with other metrics provides market surveillance teams with data-driven insights to identify potential manipulative activities compared to natural market movements. Volatility analysis is most effective when integrated into a holistic surveillance strategy.
Volatility Charts Interpretation

The visualization depicts the volatility metric over time for the LINK-USDT trading pair on Binance. Each point on the graph represents the volatility value at a specific timestamp. The graph shows how the volatility metric fluctuates over the observed period.
Volatility charts visually plot the volatility metric over time for a cryptocurrency trading pair. They provide insights into price fluctuation trends and patterns.
When analyzing a volatility chart, key areas to examine include:
- Price stability zones where volatility remains relatively consistent. These represent periods of more predictable, steady trading.
- Volatility spikes indicating abrupt price instability. These may be driven by news events, market developments, or potential manipulation.
- Periods of expanding volatility range showing increased price instability. This signals a more turbulent market.
- Volatility cycles showing rises and falls. This may reveal regular trading behavioral patterns or market open/close impacts.
- Divergences from established volatility levels. Breakouts above or below historical norms may require further investigation.
- Comparing volatility across different exchanges can also reveal telling inconsistencies potentially tied to localized manipulation efforts.
Considerations for Cryptocurrencies
Cryptocurrency volatility is often higher and more rapidly changing than traditional markets due to:
- High speculation and newness of assets
- Lower liquidity
- Sensitivity to news and social media
Analyzing cryptocurrency volatility requires dynamic, data-driven strategies accounting for fast-moving variables.
Key Takeaways
- Volatility measures price fluctuations over time.
- It indicates market stability and risks.
- Changes can signal shifting market dynamics.
- Analysis can identify potential manipulation.
- Cryptocurrency volatility requires adaptive analysis.